Prometheus 使用指南
引言
相关概念
TSDB:时序数据库 是数据库大家庭中的一员,专门存储随时间变化的数据;
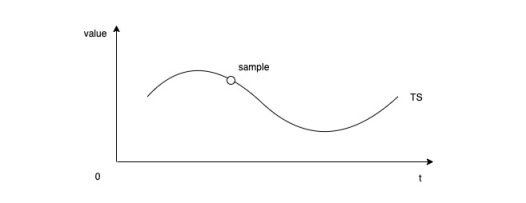
时序 (Time Series) 指的是某个变量随时间变化的所有历史;每个时序由一个名字(Metric)和一组标签 (labels) 标识定义。
样本 (Sample) 指的是历史中该变量的瞬时值;每个样本由时序标识、时间戳(一个毫秒级的 unix 时间戳)、数值 (float64 值) 3 部分构成
时序是如何被定义的?
时序格式
每个时序由一个名字(Metric)和一组标签 (labels) 标识定义的。(时序名字本质上就是一个隐藏标签)。
<metric name>{<label name>=<label value>, ...}
1 | # 该时序的名字为 api_http_requests_total,标签为 path、status、method 和 instance |
只有时序名字和标签键值完全相同的时序才是同一个时序。
Metric命名
要表示metric的功能,如http_request_total。时序的名字由 ASCII 字符,数字,下划线,以及冒号组成,它必须满足正则表达式 [a-zA-Z_:][a-zA-Z0-9_:]*, 其名字应该具有语义化,一般表示一个可以度量的指标,例如 http_requests_total, 可以表示 http 请求的总数。
Metric类型
Counter: 一种累加的metric,如请求的个数,结束的任务数,出现的错误数等Gauge: 常规的metric,如温度,可任意加减。其为瞬时的,与时间没有关系的,可以任意变化的数据。Histogram: 柱状图,用于观察结果采样,分组及统计,如:请求持续时间,响应大小。其主要用于表示一段时间内对数据的采样,并能够对其指定区间及总数进行统计。根据统计区间计算Summary: 类似Histogram,用于表示一段时间内数据采样结果,其直接存储quantile数据,而不是根据统计区间计算出来的。不需要计算,直接存储结果
Prometheus
介绍
Prometheus 是一个开源监控报警系统和时序列数据库(TSDB),使用Go语言开发。
特点
多维度数据模型。
灵活的查询语言。
不依赖分布式存储,单个服务器节点是自主的。
通过基于HTTP的pull方式采集时序数据。
可以通过中间网关进行时序列数据推送。
通过服务发现或者静态配置来发现目标服务对象。
支持多种多样的图表和界面展示,比如Grafana等。
基本原理
通过HTTP协议周期性抓取被监控组件的状态,任意组件只要提供对应的HTTP接口就可以接入监控。非常适合做虚拟化环境监控系统,比如VM、Docker、Kubernetes等。
exporter:输出被监控组件信息的HTTP接口
metrics: 指标
服务过程
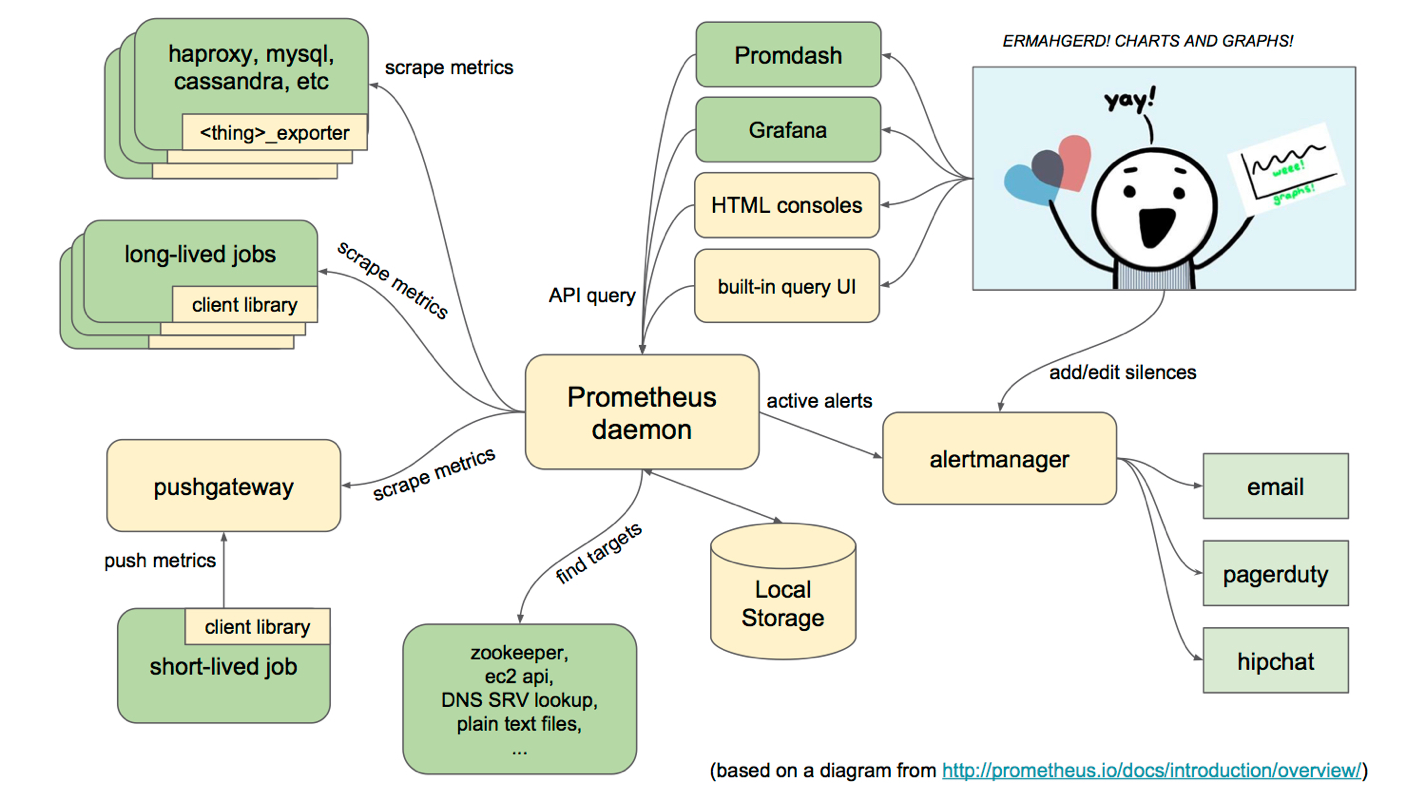
- Prometheus采用PULL的方式进行监控,在本地存储抓取的所有数据,并通过一定规则进行清理和整理数据,并把得到的结果存储到新的时间序列中。
- Prometheus通过PromQL和其他API可视化地展示收集的数据。
- PushGateway支持Client主动推送metrics到PushGateway,而Prometheus只是定时去PushGateway上抓取数据。
- Alertmanager是独立于Prometheus的一个组件,提供十分灵活的报警方式。
三大套件
Server 主要负责数据采集和存储,提供PromQL查询语言的支持。
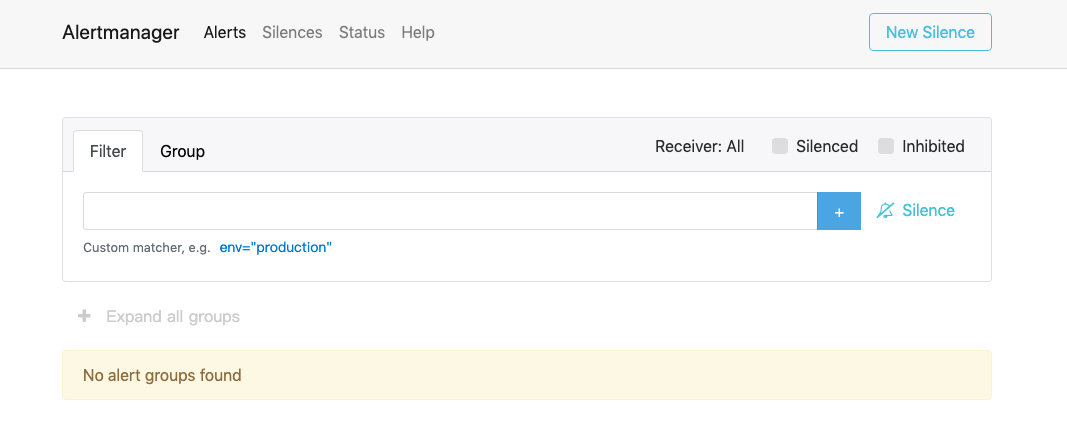
Alertmanager 警告管理器,用来进行报警。
PushGateway 支持临时性Job主动推送指标的中间网关。
架构图
安装使用
安装教程: 从零搭建Prometheus监控报警系统 > Prometheus > Pushgateway > Grafana > AlertManager
- 热加载配置文件
1 | curl -X POST http://localhost:9090/-/reload |
建立相应文件夹
1 | mkdir -p /home/promethues |
安装Prometheus-Server
- 配置
1 | global: |
- docker启动
1 | docker rm -f prometheus |
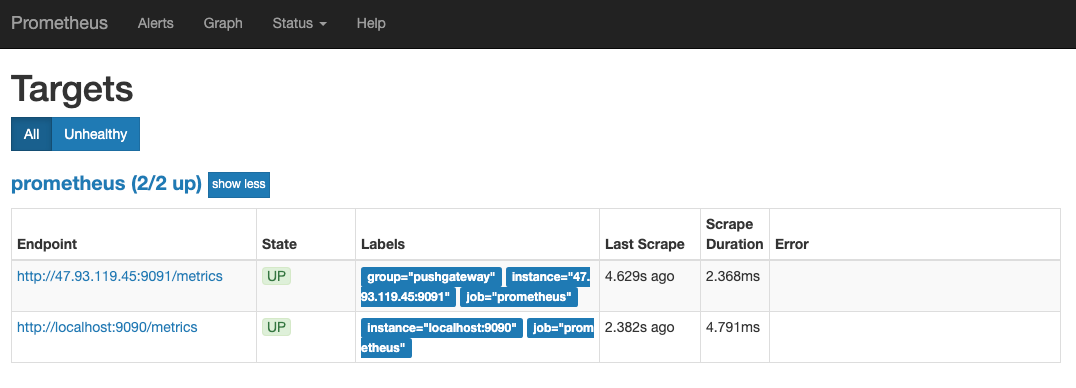
- 访问
1 | http://localhost:9090 |
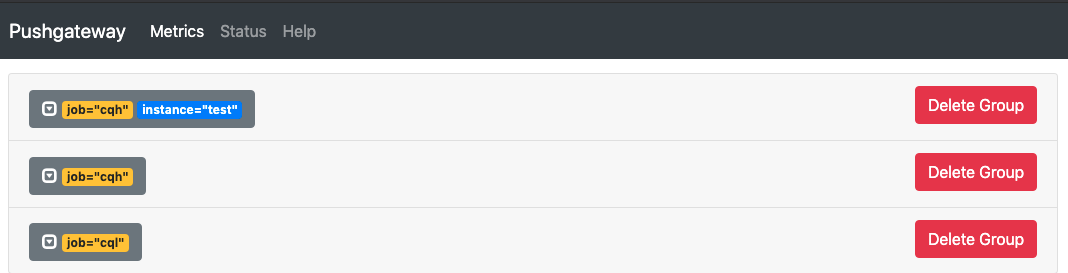
推送指标
1 | cat <<EOF | curl --data-binary @- http://47.93.119.45:9091/metrics/job/cqh/instance/test |
安装Pushgateway
安装Grafana

安装Altermanager
- Grafana是用于可视化大型测量数据的开源程序,它提供了强大和优雅的方式去创建、共享、浏览数据。
-Grafana最常用于因特网基础设施和应用分析,但在其他领域也有用到,比如:工业传感器、家庭自动化、过程控制等等。
 > 注:默认登录账户和密码都是admin
PromQL
查询时序:
count({name =~ “indexermetrics_app.*“})
PromQL (Prometheus Query Language) ,这是Prometheus开发的数据查询DSL语言,日常的可视化以及告警规则都要用到它。
基础语法
文字类型
字符串值
用单引号、双引号、反引号(不做任何转义处理)表示。
PromQL遵循与Go相同的转义规则。
单引号和双引号,用反斜杠开始一个转义序列。
反引号内不会处理任何转义, 但与Go不同,Prometheus不会在反引号内丢弃换行符。
1 | "this is a string" |
浮点值
1 | -2.43 |
注释
1 | # 这是一段注释 |
如何查询时序?
查询条件(时序选择器)
通过名称及标签进行查询。可以通过在{}使用标签匹配器列表,来过滤时间序列;
注:由于时序名字本质上就是一个隐藏标签,因此也可以通过内部_name_标签进行匹配。
1 | http_requests_total |
1 | http_requests_total{job="prometheus",group="canary"} |
标签匹配运算符
=:选择与提供的字符串完全相等的标签。
!=:选择不等于提供的字符串的标签。
=〜:选择与提供的字符串进行正则表达式匹配的标签。
!〜:选择不与提供的字符串正则表达式匹配的标签。
1 | # 查询条件支持正则匹配 |
1 | # 以下表达式选择名称以job开头的所有时序 |
如何判定标签选择器列表是否合法?
查询语句规则:必须指定一个名称或至少一个与空字符串不匹配的标签匹配器。
1 | {job=~".*"} # Bad! 同空字符串匹配 |
Offset 修饰符
offset修饰符允许更改查询中各个瞬时矢量和范围矢量的时间偏移。
1 | # 返回相对于当前查询评估时间过去5分钟的http_requests_total值: |
offset修饰符必须始终需要立即跟随选择器。
1 | sum(http_requests_total{method="GET"} offset 5m) // GOOD. |
查询表达式类型
- 瞬时向量表达式 (Instant vector): 包含一组时序,每个时序只有一个点,例如:
http_requests_total即:选择出给定的时间戳(即时)上的一组时间序列和单个样本值 - 区间向量表达式 (Range vector): 包含一组时序,每个时序有多个点,例如:
http_requests_total[5m] - 纯量表达式 (Scalar): 纯量只有一个数字,没有时序,例如:
count(http_requests_total) - String-一个简单的字符串值;目前未使用
子查询
子查询的结果是区间向量表达式。
<instant_query> [ <range> :[<resolution>] ] [offset <持续时间>]
注:
操作符
Prometheus 查询语句中,支持常见的各种表达式操作符。
算术运算符:
支持的算术运算符有 +,-,*,/,%,^
在两个scalar操作数之间,结果是另一个scalar数据;
在vector操作数和scalar操作数之间,会将运算符应用于vector中每个数据样本的值,结果是另一个vector数据。
1 | # 将 http_requests_total 所有数据 double 一倍, 每个样本都乘以2 |
在两个vector操作数之间,将运算符应用于左侧vector中的每个条目和右侧vector中匹配元素。结果是另一个vector数据,并且分组标签成为输出标签集。
注: 在右侧vector中找不到匹配条目的条目不属于结果。
比较运算符:
支持的比较运算符有 ==,!=,>,<,>=,<=, 用于过滤数据
1 | # http_requests_total 结果中大于 100 的数据 |
逻辑运算符:
支持的逻辑运算符有 and,or,unless, 只能在两个瞬时向量表达式之间使用。
vector1 and vector2 产生一个以vector1为基础交集。结果向量名称和值从vector1继承。
vector1 or vector2 产生一个并集向量,其中包含vector1的所有原始元素(标签集+值),以及在vector1中没有匹配的标签集的vector2的元素。
vector1 unless vector2,产生一个以vector1为基础的数据补集。 两个向量中的所有匹配元素都将被删除。
1 | # http_requests_total 结果中等于 5 或者 2 的数据 |
分组修饰符:
使用group_left或group_right 确定哪个向量具有更高的基数,即:谁是“多”的那侧
分组修饰符只能用于比较和算术。
聚合运算符:
可用于聚合单个瞬时向量的元素,从而产生具有聚合值的较少元素的新向量:
支持的聚合运算符有 sum,min,max,avg,stddev,stdvar,count,count_values,bottomk,topk,quantile
1 | max(http_requests_total) # 表示 http_requests_total 结果中最大的数据 |
格式:
<aggr-op> [without|by (<label list>)] ([parameter,] <vector expression>)
or
<aggr-op>([parameter,] <vector expression>) [without|by (<label list>)]
说明:
label list : 标签列表,以逗号分隔,(label1,label2)和(label1,label2,)均为有效语法。
without | by : without是从结果向量中删除列出的标签,by是从结果中只保留列出的标签
parameter: 只能在count_values, quantile, topk, bottomk使用
特别说明:
count_values : 相同值元素的数量,每个唯一样本值输出一个时间序列。 每个时间序列的值是样本值出现的次数。
quantile : 分位数计算, eg: 中位数quantile(0.5,…),95分位,quantile(0.95, …)
topk ,bottomk : 样本值最大、最小的k个元素,将输入样本的一个子集(包括原始标签)返回到结果向量中,此时by和not仅用于存储输入向量,
运算符优先级
优先级由高到低如下:
^*,/,%+,-==,!=,<=,<,>=,>and,unlessor
优先级相同的运算符是左关联的。
1 | 2 * 3 % 2 等价于 (2 * 3)%2。 |
数据匹配
数据之间运算,尝试在左侧数据中,为每个样本找到匹配的元素。
匹配类型
一对一
格式: vector1 <operator> vector2
如果两个条目具有完全相同的一组标签和相应的值,则它们匹配。
ignoring关键字允许在匹配时忽略某些标签
on关键字允许将考虑的标签集减少到提供的列表中
<vector expr> <bin-op> ignoring(<label list>) <vector expr>
<vector expr> <bin-op> on(<label list>) <vector expr>
多对一/一对多
将“一个”侧的每个矢量元素都可以与“许多”侧的多个元素匹配
分组修饰符
必须使用group_left或group_right修饰符明确地请求它,其中left / right确定哪个向量具有更高的基数。
<vector expr> <bin-op> ignoring(<label list>) group_left(<label list>) <vector expr>
<vector expr> <bin-op> ignoring(<label list>) group_right(<label list>) <vector expr>
<vector expr> <bin-op> on(<label list>) group_left(<label list>) <vector expr>
<vector expr> <bin-op> on(<label list>) group_right(<label list>) <vector expr>
举例:
1 | method_code:http_errors:rate5m{method="get", code="500"} 24 |
1 | # 左侧为“多的”的那侧,右侧的元素与左侧具有相同方法标签的多个元素匹配; |
注:多对一和一对多匹配使用的不太多,谨慎考虑使用。
基本查询
- 查询当前所有数据
1 | logback_events_total |
- 模糊查询: level=”inxx”
1 | logback_events_total{level=~"in.."} |
- 比较查询: value>0
1 | logback_events_total > 0 |
- 范围查询: 过去5分钟数据
1 | logback_events_total[5m] |
- 时间范围单位有以下:
s: 秒m: 分钟h: 小时d: 天w: 周y: 年
在瞬时向量表达式或者区间向量表达式中,都是以当前时间为基准。
如果想查询5分钏前的瞬时样本数据,则需要使用位移操作,关键字:**offset**, 其要紧跟在选择器{}后面。如:
1 | sum(http_requests_total{method="GET"} offset 5m) |
###内置函数
Prometheus 内置不少函数,方便查询以及数据格式化,
- 将浮点数转换为整数
1 | # 将结果由浮点数转为整数的 floor 和 ceil, |
- 查看每秒数据 :
1 | # 查看 http_requests_total 5分钟内,平均每秒数据 |
| 函数名 | |
|---|---|
| abs(v instant-vector) | 取结果数据的绝对值 |
| absent(v instant-vector) | 瞬时向量表达式有数据,返回空;无数据,返回1;eg: 判断指标为空时使用 |
| absent_over_time(v range-vector) | 区间向量表达式有数据,返回空;无数据,返回1;eg: 判断指标为空时使用 |
| floor(v instant-vector) | 将结果由浮点数转为整数,向下取整 |
| ceil(v instant-vector) | 将结果由浮点数转为整数,向上取整 |
| changes(v range-vector) | 在提供的时间范围内变化的次数作为瞬时向量表达式 |
| clamp_max(v instant-vector, max scalar) | 设置结果上限最大值 |
| clamp_min(v instant-vector, min scalar) | 设置结果下限最小值 |
告警规则
比如单台Nginx active指标超过1w就要发出告警,
1 | nginx_http_connections{instance="172.18.11.192:9145",state="active"} > 10000 |
完整的告警规则如下:
1 | #group:定义一组相关规则 |
查询所用的时间戳
运行查询时,将选择采样数据的时间戳,而不依赖于实际的当前时间序列数据。 这主要是为了支持诸如聚合(求和,平均等)的情况,其中多个聚合时间序列未在时间上精确对齐。由于它们的独立性,Prometheus需要为每个相关时间序列在那些时间戳上分配一个值。因此,只需在此时间戳之前获取最新样本即可。
避免慢查询和重载
在对未知数据构建查询时,先在Prometheus表达式浏览器的表格视图中构建查询,直到结果集看起来合理为止,在切换到图形模式。避免对其进行图形化处理可能会超时或使服务器或浏览器超载。。
另外,即使输出只是少量时间序列,在许多时间序列上聚合的表达式也会在服务器上产生负载。 类似于将关系数据库中的列的所有值相加会很慢,即使输出值只是一个数字也是如此。
最多数支持百个时间序列,而不是数千个。
检查prometheus.yml配置是否有效? - promtool prometheus附带了一个check config命令
检查配置
1 | ./promtool check config prometheus.yml |
正常返回状态
1 | Checking prometheus.yml |
错误返回状态
1 | Checking prometheus.yml |
生成式 PromQL
参考项目
采用链式编程模式
https://blog.csdn.net/sinat_26682309/article/details/90301904
https://studygolang.com/articles/15134
解析PromQL 为对象
https://github.com/VictoriaMetrics/metricsql